The markets traded in a much wider range in the past trading week. Over the past few days, we had seen the markets and the VIX inching higher, i.e., moving in the same direction. In the previous technical note, we had expressly mentioned this concern as instances of VIX and the Index rising higher simultaneously often end up showing a warning sign of an impending corrective move. The last trading day of the week saw the Index swinging wildly. During the week, the Nifty oscillated in a 446.65 range before closing the week on a flat note. The benchmark Index posted minor weekly gains of 55.90 points (+0.25%)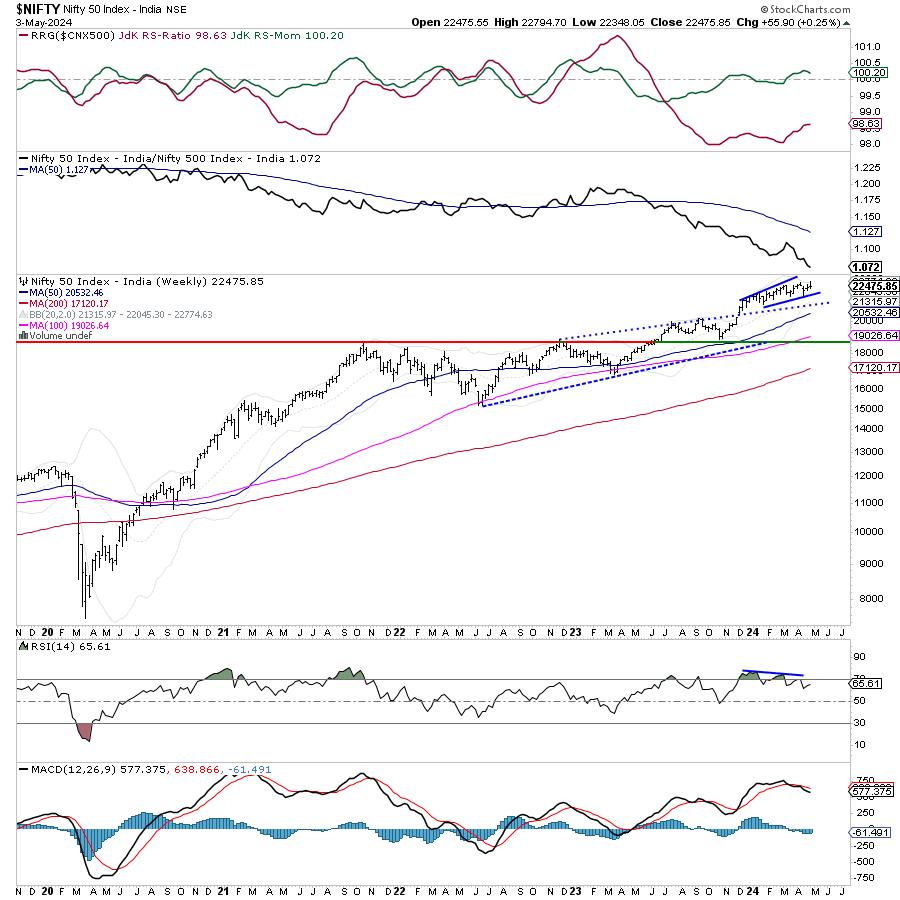
There is something more that needs to be noted from a technical perspective. While the Nifty has stayed flat, the volatility has shown a huge spike. This is evident from the India Vix spiking by a massive 33.80% to 14.62. This continues to show some quantum of uneasiness in the markets. More so, the rise in the VIX and the NIFTY over the past few days has made the markets vulnerable to profit-taking bouts like the one seen on Friday. Historical data shows that often through such behavior, VIX has ended up issuing prior warnings to any impending profit-taking bout. The NIFTY did mark its fresh lifetime high of 22794.70; however, the 22775 level still remains an immediate top for the markets as it was not taken out convincingly. In short, so long as Nifty stays below 22775, it is likely to consolidate in a broad trading range showing volatile moves on either side.
Monday is likely to see a stable start to the trade. The levels of 22650 and 22775 are likely to act as potential resistance levels. The supports come in at 22300 and 22050 levels.
The weekly RSI is 65.61; it stays neutral and does not show any divergence against the price. The weekly MACD stays bearish and trades below its signal line. A Doji has been formed on the candle; its emergence near the high point has the potential to disrupt the ongoing trend in the markets. Historically, Doji’s have been more potent comparatively to form reversals; however, they would need confirmation on the next bar.
The pattern analysis of the weekly chart shows that Nifty continues to trade in a small rising channel and the 20-week MA which is currently placed at 22045 happens to be the nearest support for the Index. If this level gets violated, then it would be the first sign of the markets likely taking some breather and the present trend getting temporarily disrupted.
All in all, the markets are likely to adopt some defensive bias in the future; we may see some defensive pockets doing well over the coming days. Some technical rebounds too can be expected. However, it is strongly recommended that we use these technical rebounds as and when they occur to protect the profits at higher levels. Fresh purchases should be made extremely carefully and only in the stocks that are developing or bettering their relative strength against the broader markets. A cautious approach is advised for the coming week.
Sector Analysis for the coming week
In our look at Relative Rotation Graphs®, we compared various sectors against CNX500 (NIFTY 500 Index), which represents over 95% of the free float market cap of all the stocks listed.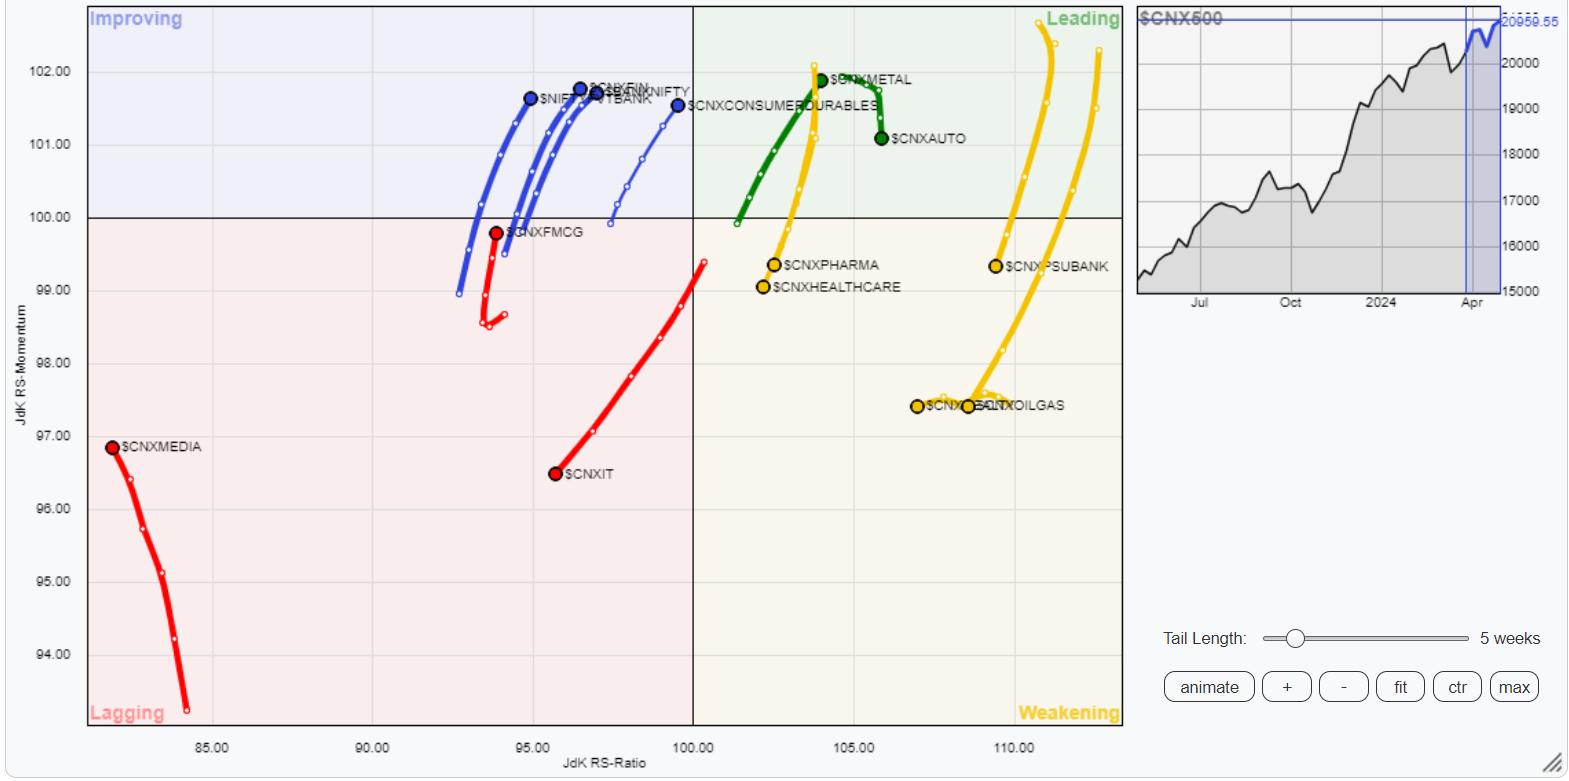
Relative Rotation Graphs (RRG) show that only Nifty Metal, Auto, and Consumption Indices are inside the leading quadrant. Among these, though the Auto group is seeing some paring of relative momentum, these groups are likely to relatively outperform the broader markets collectively.
The Nifty Commodities, Energy, Midcap 100, Realty, PSE, PSUBank, Infrastructure, and Pharma indices are inside the weakening quadrant. They are expected to slow down on their relative performance; individual stock-specific shows may be seen.
While Nifty IT continues to languish inside the lagging quadrant, the FMCG and Media Indices are seen improving on their relative momentum against the broader Nifty 500 index.
Banknifty, Nifty Financial Services, and Service Sector Indices are inside the improving quadrant; they are expected to continue bettering their relative performance against the broader markets.
Important Note: RRG™ charts show the relative strength and momentum of a group of stocks. In the above Chart, they show relative performance against NIFTY500 Index (Broader Markets) and should not be used directly as buy or sell signals.
Milan Vaishnav, CMT, MSTA
Consulting Technical Analyst