 Trends often start with outsized moves. But how do we measure and identify such moves? Chartists can measure moves in Average True Range (ATR) terms using the ATR Trailing Stop SAR indicator (ATR-SAR). ATR is a volatility indicator developed by Welles Wilder. For example, a 4 ATR advance off a low would signal an outsized move that could jumpstart an uptrend. Conversely, a 4 ATR decline off a high would signal an outsized move that could jump-start a downtrend or corrective period. Today’s report will highlight the outsized decline in the Home Construction ETF (ITB) and show this indicator for the Semiconductor ETF (SOXX).
ATR-SAR is the bull/bear version of the ATR Trailing Stop, both of which are part of the TIP Indicator Edge Plugin for StockCharts ACP. SAR stands for “stop and reverse”, which means the line switches sides with price breaks. When prices are rising, ATR-SAR is green and under the price. It acts as a trailing stop for a long position or an uptrend marker. When prices are falling, ATR-SAR is red and above price. It then acts as a stop for shorts or a downtrend marker. Let’s look at an example using 22 periods for the Average True Range and 4 for the multiplier.
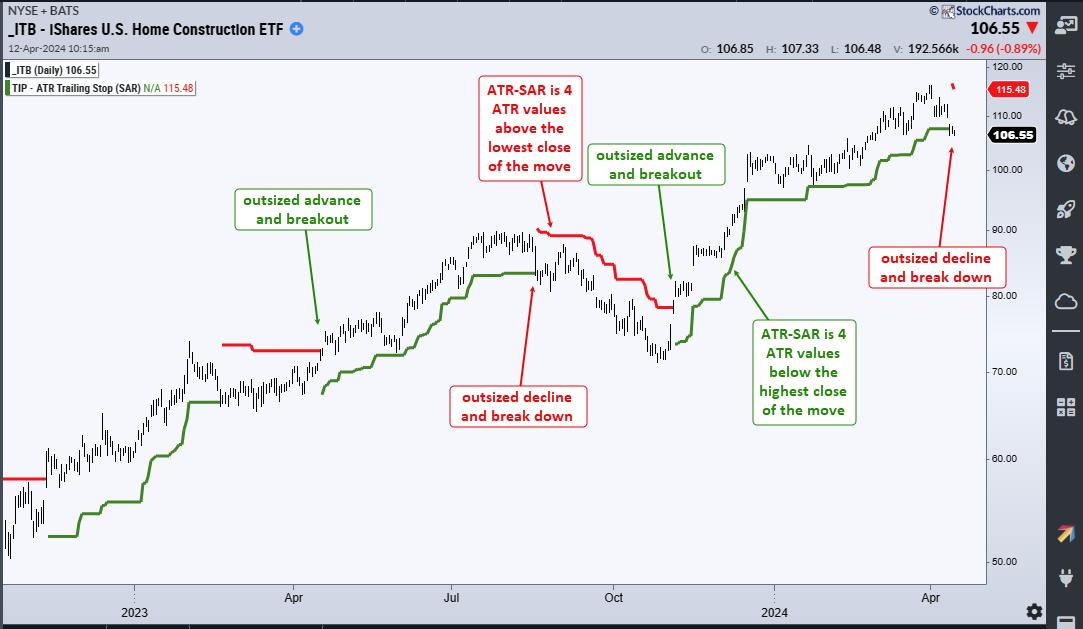
The chart above shows the Home Construction ETF (ITB) with ATR-SAR (22,4). It turned green in November as ITB surged and broke out with an outsized advance. The ATR-SAR line turned green and remained 4 ATR(22) values below the highest close as prices rose. ITB fell sharply this week and broke the ATR-SAR line. This signals an outsized decline that could jump-start a downtrend or correction.
Outsized declines can jump-start downtrends and outsized advances can jump-start uptrends. Notice that ITB held this ATR-SAR line from early November to early April. Declines during this period were less than 4 x ATR(22) values. The April decline broke this ATR-SAR line, meaning the decline was MORE than 4 x ATR(22) values. In other words, it was an outsized decline. Also notice that an outsized advance in early November jump-started the uptrend.
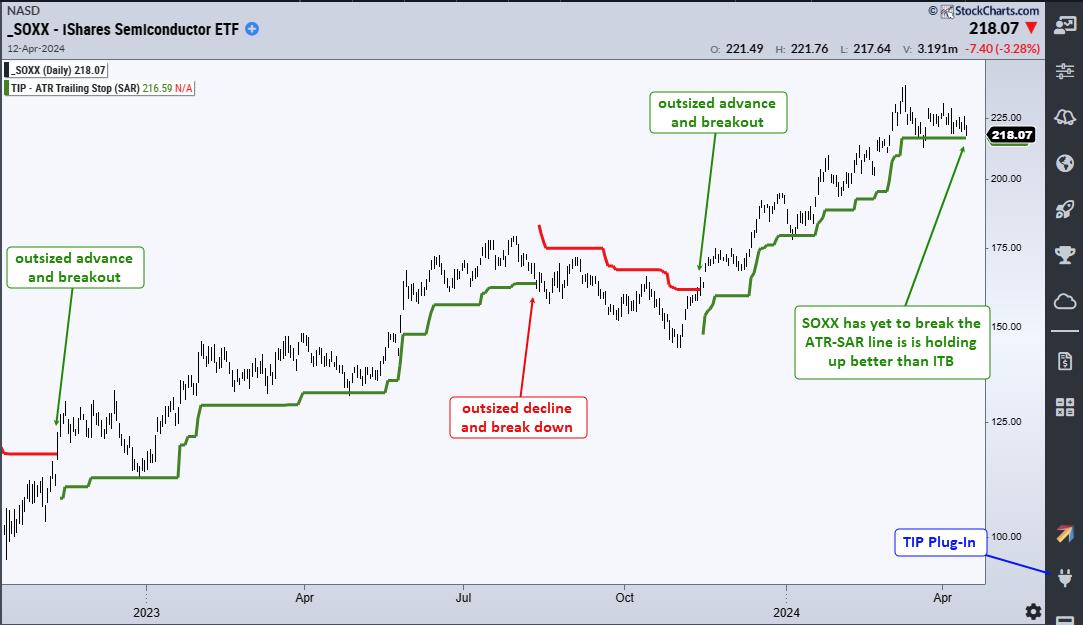
Elsewhere, the EW Consumer Discretionary ETF (RSPD) and the Retail SPDR (XRT) also fell sharply and broke their ATR-SAR (22,4) lines. These were highlighted in Thursday’s report and video at TrendInvestorPro. This means three economically sensitive groups reversed their uptrends this month (consumer discretionary, housing and retail). Elsewhere note that the Software ETF (IGV), Cybersecurity ETF (CIBR) and Cloud Computing ETF (SKYY) broke their ATR-SAR lines on February 21st. The Technology SPDR (XLK), Mobile Payments ETF (IPAY) and Semiconductor ETF (SOXX) have yet to break their ATR-SAR lines. The chart above shows SOXX holding up better than ITB.
TrendInvestorPro offers two services. First, System Trader provides fully quantified momentum strategies for trading Nasdaq 100 and S&P 500 stocks. These strategies are designed to identify leading stocks and hold them as long as they lead. Second, Chart Trader reports and videos focus on stocks and ETFs with uptrends and tradeable patterns. Each week we cover the overall market environment and then feature highly curated trading ideas. Click here to learn more and get immediate access.
//////////////////////////////////////////////////